February 12, 2018
Meridith Timony
U.S. EPA – Region 1
5 Post Office Square, Suite 100
Boston MA 02109-3912
Subject: Springfield Regional Wastewater Treatment Facility draft NPDES Permit
Permit Number: MA0101613, Public notice MA-004-18
Replaces permit MA010331
Dear Ms. Timony,
I am submitting comments on the draft National Pollutant Discharge Elimination System (NPDES) permit for the Springfield Water and Sewer Commission’s (SWSC’s) Regional Wastewater Treatment Plant (WWTP) on behalf of the Connecticut River Watershed Council, now doing business as the Connecticut River Conservancy. The Connecticut River, an American Heritage River and America’s only National Blueway, is a regional resource that merits the highest level of protection. Designed to fully treat an average flow of 67 million gallons per day (MGD), the SWSC facility is the largest wastewater treatment facility in the Massachusetts portion of the Connecticut River watershed. The Connecticut River downstream of the Holyoke Dam to the Connecticut state border is listed as an impaired water body due to priority organics, pathogens, and total suspended solids. CRC is particularly interested in improving water quality in the Connecticut River so that it can support existing primary and secondary contact uses, even during wet weather. CRC believes that the Connecticut River can meet Class B water quality during wet weather and be made safe for swimming, if state and federal regulators work aggressively with other stakeholders to ensure compliance with Clean Water Act goals. CRC has also been following the work of the Long Island Sound TMDL workgroup to reduce nutrient discharges into Long Island Sound.
This draft permit combines two permits into one, replacing the existing permit for the WWTP (MA0101613) last issued in 2000 and the CSO permit (MA 010331) last issued in 2009. On May 24, 2016, the Connecticut Fund for the Environment requested that EPA modify, revoke and re-issue, or terminate these NPDES permits. CRC, as CRWC, signed on in support. In this draft permit, EPA has finally moved to update a permit that is 17 years old, and has been administratively continued for 12 years.
Our comments are below.
- The protection of existing uses is required under 40 CFR 131.12(a)(1). Below is our understanding of existing uses in the area affected by the SWSC system.
- Medina Street Boat ramp – located just upstream of the confluence with the Chicopee River. A popular launching point for motor boats, especially in May and June.
- Chicopee River confluence – a popular 24-hr/day fishing location during migratory fish season.
- Pioneer Valley Riverfront Club – youth and adult rowing programs, dragon boating, running and biking. See http://www.pvriverfront.org/
- West Springfield boat ramp – new cartop boat ramp installed in the last 10 years.
- Bondi’s Island Boat Ramp – boat ramp located just upstream of the WWTP.
- Pynchon Point – cartop access located just downstream of the confluence with the Westfield River.
- Springfield Yacht Club – located in Agawam, providing boat slips for motor boats and sailboats. See https://www.sycc.website/ .
- Pioneer Valley Yacht Club – located in Longmeadow, providing boat slips for motor boats, sailboats, and rowing access. See http://www.ourpvyc.net/ .
- Riverfront Park and Fannie Stebbins Wildlife Refuge – Longmeadow public boat access, trails, and nature area that is now part of the Silvio Conte National Wildlife Refuge
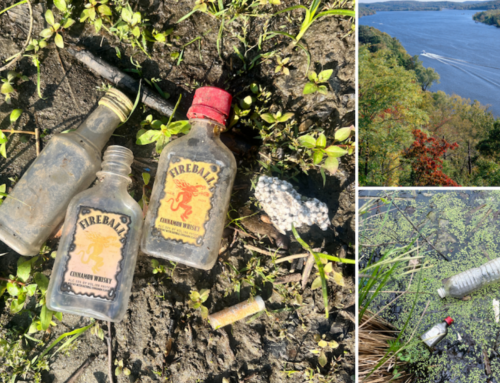
- Bike paths along the CT River in Springfield and Agawam – ideally, people use the riverfront area in Springfield and Agawam for recreation, although it gets some amount of homeless housing activity. People fish from the banks right next to CSO outfalls and where the Mill River discharges into the CT River.
- Thompsonville Boat Ramp in Connecticut – improved boat ramp for all types of craft, located a couple miles downstream of the MA/CT state line.
- This section of the river, though urbanized, also contains important fish and wildlife habitat. Many migratory fish pass by the section of Connecticut River affected by the WWTP and CSOs on their way upstream from Long Island Sound, either on their way to the Westfield River, the lower Chicopee River, or the Connecticut River to the fish lift at the Holyoke Dam. These fish include the endangered shortnose sturgeon. In 2017, migratory fish numbers that passed above Holyoke are as follows: 11 Atlantic salmon; 536,670 American shad; 875 blueback herring; 451 striped bass; 85 federally endangered shortnose sturgeon; 740 gizzard shad; 21,526 sea lamprey; and 17,037 American eels. In 2017, 6,000 shad; 5 Atlantic salmon; 5 river herring; and 249 sea lamprey were counted at the fish ladder on the lowermost dam on the Westfield River.
- CRC supports the inclusion of co-permittees in this permit, the towns of Agawam, East Longmeadow, Longmeadow, Ludlow, West Springfield, and Wilbraham.
- CRC is glad that the permit has finally been updated to include a pathogen limit based on coli levels, rather than fecal coliform.
- CRC supports the increased frequency of sampling of nitrogen compounds from monthly to weekly.
- CRC recommends that total phosphorus sampling be required as part of this permit. Eurasian water milfoil is present in the Connecticut portion of the Connecticut River. Understanding both the phosphorus and nitrogen inputs in the Connecticut River is important to understanding the spread of weeds like milfoil, as well as cyanobacteria outbreaks, if and when they occur.
- Section I.B.3.b of the draft permit now requires that CSO structures and regulators be inspected once per month, down from twice weekly. Holyoke and Chicopee are required to do monthly inspection of their CSO structures also. CRC recommends the frequency be appropriate for finding and fixing problems that arise. We note that twice weekly may be burdensome, but once a month may not be often enough.
- Section I.B.3.d prohibits dry weather overflows. The previous CSO permit defined “dry weather” as less than 0.1 inch of precipitation or snowmelt in a calendar day. CRC recommends that a definition of dry weather be re-instated in the final permit.
- Section I.B.3.g requires a public notification plan. CRC notes that none of the CSO communities along the Connecticut River in Massachusetts appear to be doing any kind of public notification, despite permit requirements. We have been supportive of a sewage spill public notification bill going through the Massachusetts legislature. The proposed notification in the draft permit seems potentially unrealistic, given the challenge of having accurate data on when CSOs are discharging. We also think bypass flows and blended flows also be part of public notification. We’d be amenable to an automated notification built into the SWSC website, or a CT River centralized website, that would predict, based on rainfall data, where in the system there is likely to be a CSO activation (Chicopee River, Mill River, north/south CT River mainstem, and on the Bondis Island side). Making a table available to the public like that in Attachment D to the Fact Sheet (along with information on CSO outfall locations), would also be very helpful.
- Section I.B.3.e requires National Weather Service precipitation data be recorded for each CSO discharge event. This information should also be included in the annual CSO report required in draft permit Section I.B.4 and the DMR data required in draft permit Section I.B.5.a.
- Section I.D.4 and I.D.5 requires a collection system map and a collection system operation and maintenance plan, respectively, and CRC thinks the requirement is appropriate.
- Section I.G includes some new industrial pretreatment program requirements, of which we are supportive.
- Section I.H. includes special conditions for nitrogen, which is new to this permit. The draft permit proposes an annual average mass discharge of total nitrogen capped at the existing average mass loading of 2,279 lbs/day. The Fact Sheet also provides two other alternatives for Total Nitrogen Optimization Benchmarks, based on a total nitrogen (TN) concentration benchmark of 8 mg/L, one including a loading benchmark based on existing flows, and one with no loading benchmark. CRC has discussed these three options with the SWSC and our understanding is that they prefer Alternative 2, and feel that they can meet a concentration benchmark of 8 mg/L. Based on Attachment H to the Fact Sheet, the TMDL based on 2004-2005 used data from two years when the plant was discharging TN at concentrations between 0.988 mg/L (this seems wrong) and 7.29 mg/L. We aren’t sure why, if Springfield has been doing N optimization, the concentrations have been consistently higher during the last several years.
The draft permit proposal of a loading benchmark of 2,279 lbs/day based on existing loading values is consistent with the way EPA has set Total Nitrogen limits for other NPDES permits in the Massachusetts part of the Connecticut River watershed. We looked at the nitrogen general permit in Connecticut, and see that the Hartford MDC facility, which has a design capacity of 80 MGD (20% larger than Springfield), has a limit of 2,377 lbs/day (only 4 % higher than the proposed limit for Springfield). This amounts to a TN concentration of 3.56 mg/L if you use the design flow of 80 MGD.
CRC notes that using existing flow to set limits is inconsistent with the approach EPA uses to establish loading values in all permits, such as BOD and TSS and also the “reasonable potential analysis for metals (Table 2 in the Fact Sheet). In this permit, they are all based on the design flow of 67 MGD.
CRC also notes that one phase in Springfield’s Integrated Wastewater Plan is to provide 62 MGD pumping capacity at the York Street pump station and a new 48-inch diameter river crossing from the collection system to the WWTP, new storage, and conveyance for relief of the Connecticut River interceptor. If the end result of this is a higher capacity to treat larger volumes of wastewater, and EPA and MassDEP approved of this plan, then SWSC should not necessarily be penalized for treating extra volumes and not meeting TN targets based on the previous average flow of the plant.
If a loading value is calculated using the design flow of 67 MGD and a concentration of 8 mg/L, the total nitrogen would be 4,470 lbs/day. Should Springfield’s flow increase, the permit would allow an unreasonably high TN loading amount, and for this reason, CRC does not support Alternative 2. Attachment H shows that between 2001 and 2016, the average total nitrogen concentration was 5.46 mg/L, and varied quite a bit from 0 (not a realistic number) to 15.23 mg/L. SWSC would seemingly not be able to meet an enforceable limit based on a 8 mg/L concentration limit consistently. Increasing the sampling from monthly to weekly will allow for better understanding of the performance, which emphasizes again that this permit should have been updated long ago.
CRC recommendation: CRC requests that EPA set an enforceable permit limit that is consistent with anti-backsliding provisions and is based on the design flow of the plant. We recommend that the average TN treatment performance of the facility over the past 15 years be used (5.5 or rounded up to 6 mg/L) to calculate a loading value of 3,073 lbs/day or 3,353 lbs/day, respectively. Then, subtract out a 25% reduction to be somewhat consistent with the approach of the current TMDL. This would mean a loading of 2,305 lbs/day (based on 5.5 mg/L) or 2,514 (based on 6 mg/L). Under current flow rates, the facility would seemingly have no problem meeting this limit. Under increased flows, the facility would also typically be able to meet this limit, when flows and concentrations are averaged over the course of the year. We believe this approach is consistent with the 2015 Long Island Sound Nitrogen Reduction Strategy — capping WWTPs at or near current total nitrogen loads, yet also sensitive to the SWSC’s plans to be sending and treating additional sewage volumes to the WWTP. Future iterations of the permit will have the benefit of more data and a better understanding of nutrient loadings under the Nutrient Reduction Strategy.
- We have several comments on the CSO overflow events and volumes shown in Attachment D. To start, we are assuming that the volumes for 2016 are an order of magnitude wrong, and were not properly converted to the 1,000’s of gallons that the rest of the table was based on. We also recognize that estimation of CSO discharges is an imperfect science.
Construction to reduce discharges from the Mill River CSOs was completed in 2003. In 2000, the draft LTCP showed in Table 5-3 that the Mill River CSOs were discharging 134 times in a typical year with a volume of 61.21 million gallons (MG). Springfield’s 2014 Integrated Wastewater Plan in Vol 1 appendix B indicates that the post-construction baseline activation frequency (based on 1976 as a typical year) is 15 times with a volume of 1.1 MG. Attachment D of the Fact Sheet indicates the Mill River system has been, in reality, discharging between 47-113 times per year, at a volume of 3.6-29.1 MG between 2012 and 2016. The latter year was one of the most severe drought years since the 1960’s, and even then, annual discharge volumes were 300% more than designed. Improvement has been made, but not nearly as much as what was anticipated.
Construction to reduce discharges from the Chicopee River CSOs was completed in 2009. In 2000, the draft LTCP showed in Table 5-3 that the Chicopee River CSOs were discharging 92 times in a typical year with a volume of 22.55 MG. Springfield’s 2014 Integrated Wastewater Plan in Volume 1 Appendix B indicates that the post-construction baseline activation frequency (based on 1976 as a typical year) is 3 times with a volume of 0.31 MG. Attachment D of the Fact Sheet indicates the Chicopee River system has, in reality, been discharging 32-82 times per year, at a volume of 1.9-11 MG between 2012 and 2016. The latter year was one of the most severe drought years since the 1960’s, and even then, annual discharge volumes were 500% more than designed. Improvement has been made, but not nearly as much as what was anticipated.
Unless the Mill River and Chicopee River CSO abatement projects were not actually constructed as designed, it is evident that using 1976 as the typical precipitation year is a mistake. CRC implores that EPA and DEP abandon the use of 1976 as the “typical year” in projects from this point forward, and use modern day climate data and climate predictions to design CSO projects.
CRC appreciates the opportunity to provide comments on the draft permit. I can be reached at adonlon@ctriver.org or (413) 772-2020 x.205.
Sincerely,
Andrea F. Donlon
River Steward
Cc: Brian Harrington, MassDEP
Denise Ruzicka, CT DEEP
Bill Fuqua, SWSC
Jack Looney, Connecticut Fund for the Environment, Inc.